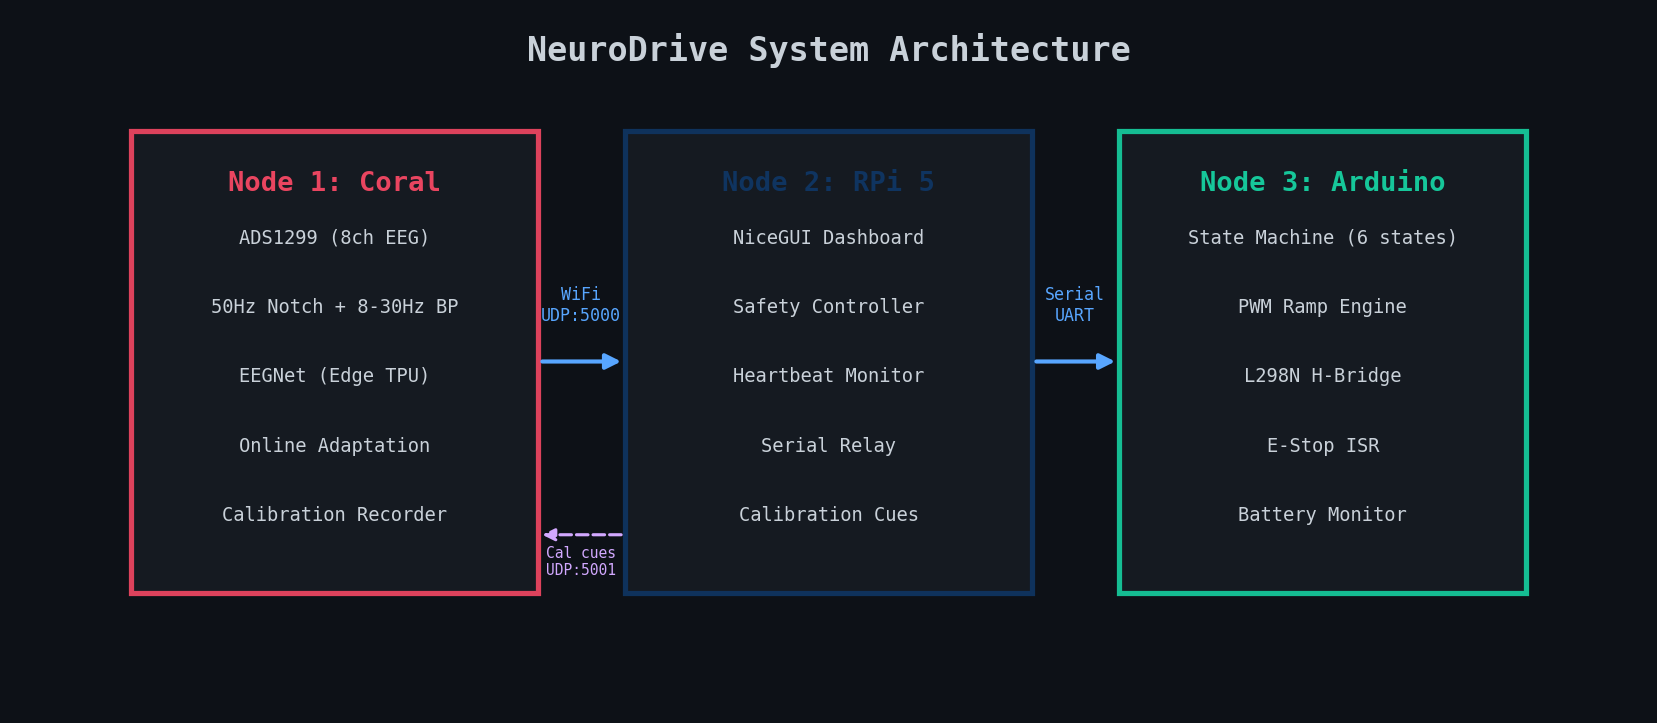
Three dedicated nodes, each optimized for its role. Communicating over WiFi (UDP) and Serial (UART).
Node 1 handles real-time ML (latency-critical), Node 2 handles UI and safety (compute-heavy), Node 3 handles motors (reliability-critical). Calibration commands flow back from Node 2 to Node 1 on UDP:5001.
Node 1: Coral Dev Board Mini
ARM CPU + Edge TPU + ADS1299 ADC
8-channel 24-bit EEG acquisition via SPI (1 MHz)
50Hz notch + 8-30Hz bandpass filtering
EEGNet inference on Edge TPU (~4ms)
Online adaptation (pseudo-label learning)
Calibration recording + auto fine-tune
Lead-off detection from ADS1299 status bytes
Node 2: Raspberry Pi 5
4GB RAM + WiFi + USB Serial
NiceGUI dark-theme web dashboard
Drive / Calibrate / Settings tabs
Safety logic + heartbeat timeout (3s)
Serial relay to Arduino (115200 baud)
Visual calibration cue protocol
Manual D-pad override + E-stop
Node 3: Arduino Mega 2560
ATmega2560 + L298N H-Bridge
6-state finite state machine
Smooth PWM ramp engine (step=5, 20ms)
Hardware E-stop interrupt (ISR, pin 18)
Battery voltage monitor (warn 11V, cut 10.5V)
Serial watchdog (2s timeout)
State acknowledgement every 200ms
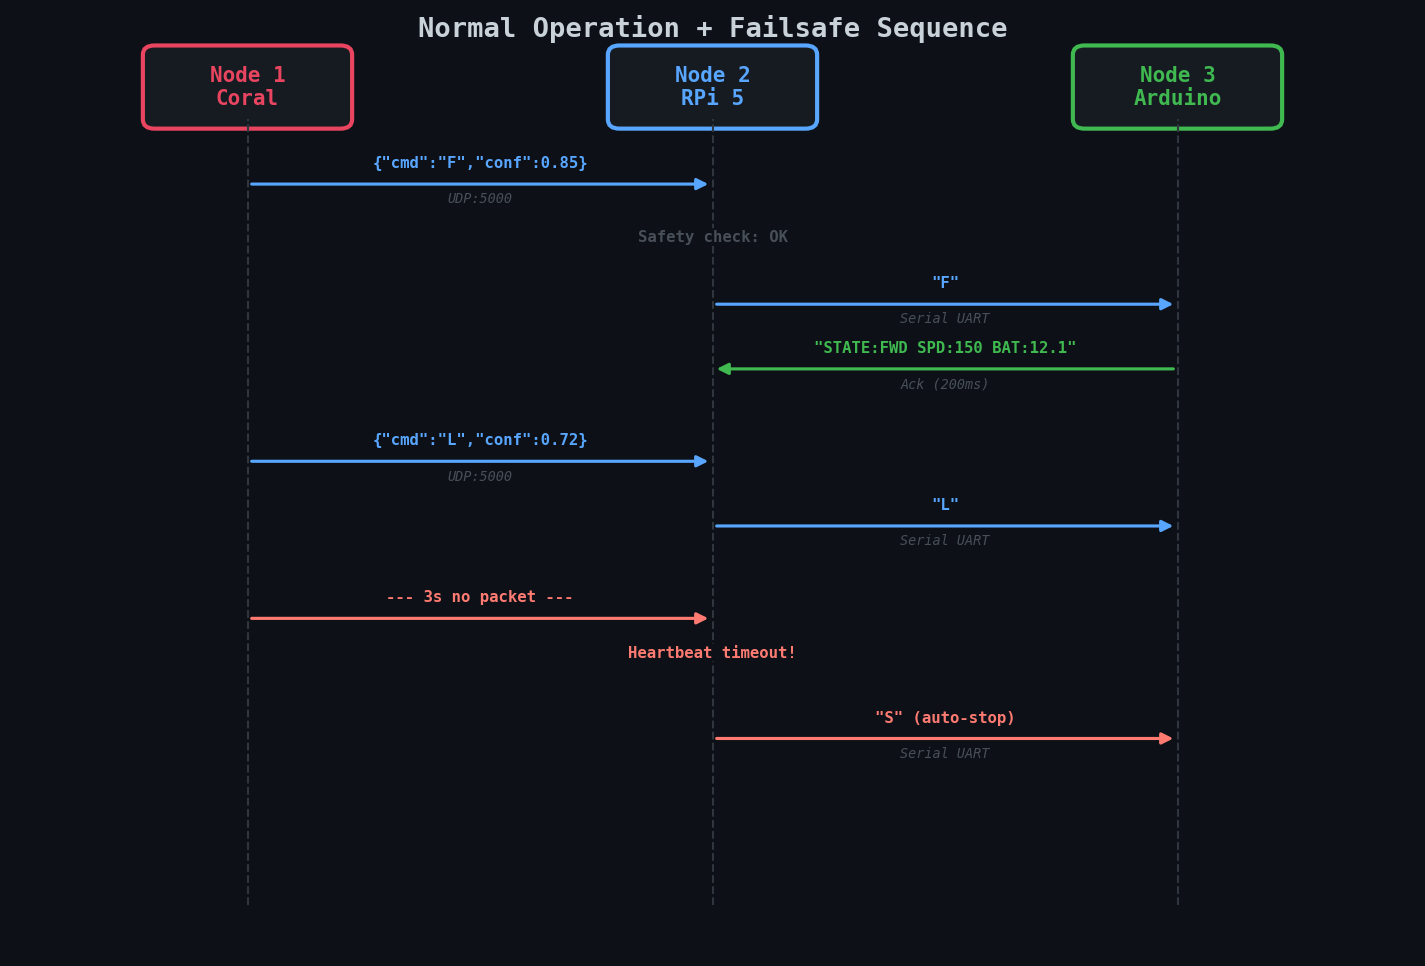
Message sequence showing normal operation and failsafe behavior. When Node 1 stops sending packets for 3 seconds, Node 2 automatically issues a STOP command to protect the user.
EEG Signals & Motor Imagery
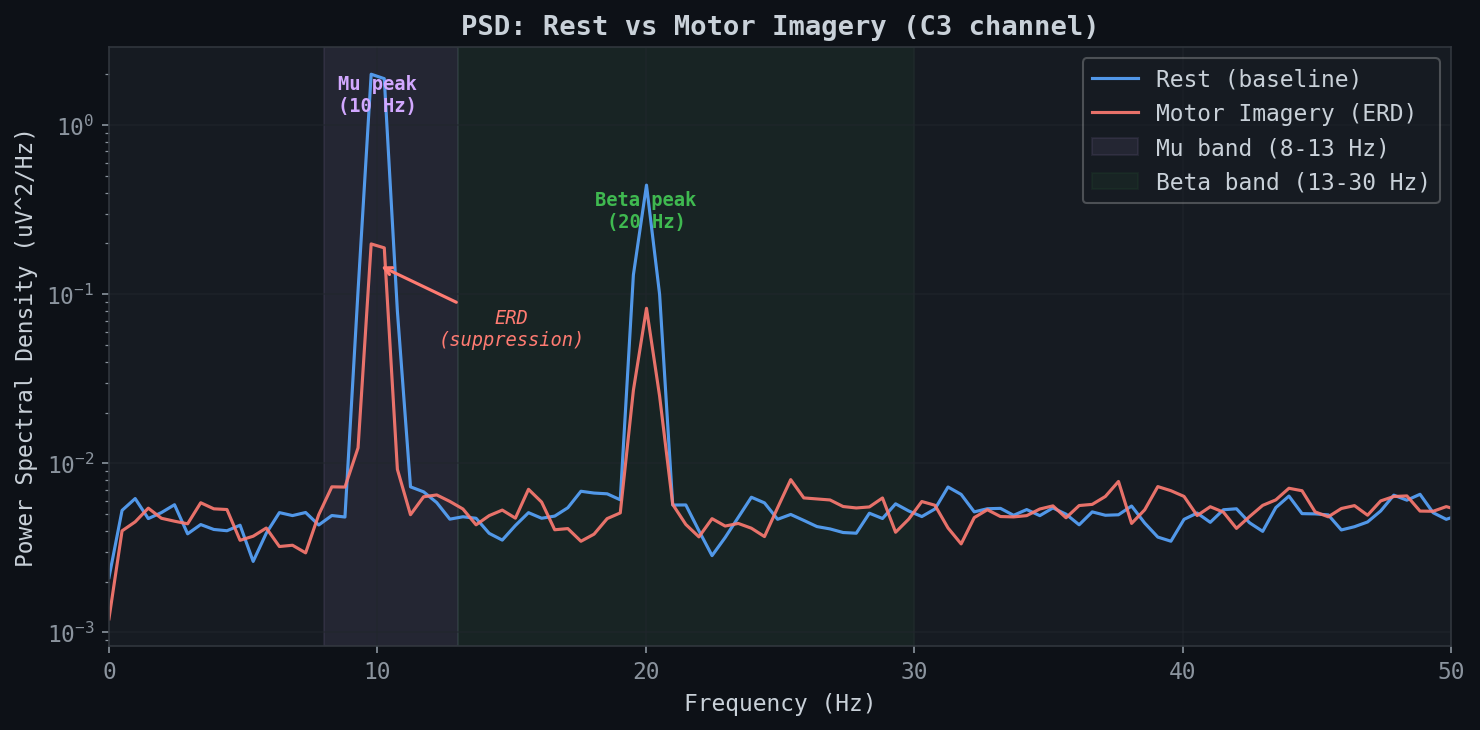
Motor imagery produces measurable changes in brain rhythms. When you imagine moving your right hand, the left motor cortex (C3) shows Event-Related Desynchronization (ERD) -- a suppression of mu (8-13Hz) and beta (13-30Hz) power.
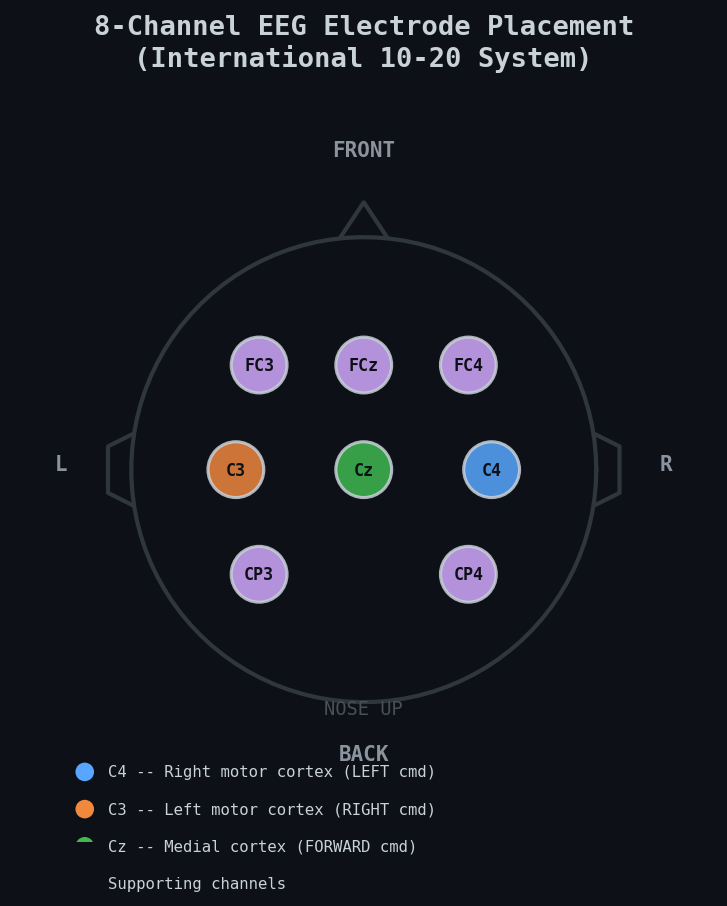
8-channel electrode placement following the International 10-20 system. Color coding shows which channels are primary drivers for each command. Supporting channels improve spatial filtering.
Power spectral density comparison between rest and motor imagery on C3. Clear mu (10Hz) and beta (20Hz) peaks during rest are suppressed during imagery -- this is the ERD signal we detect.
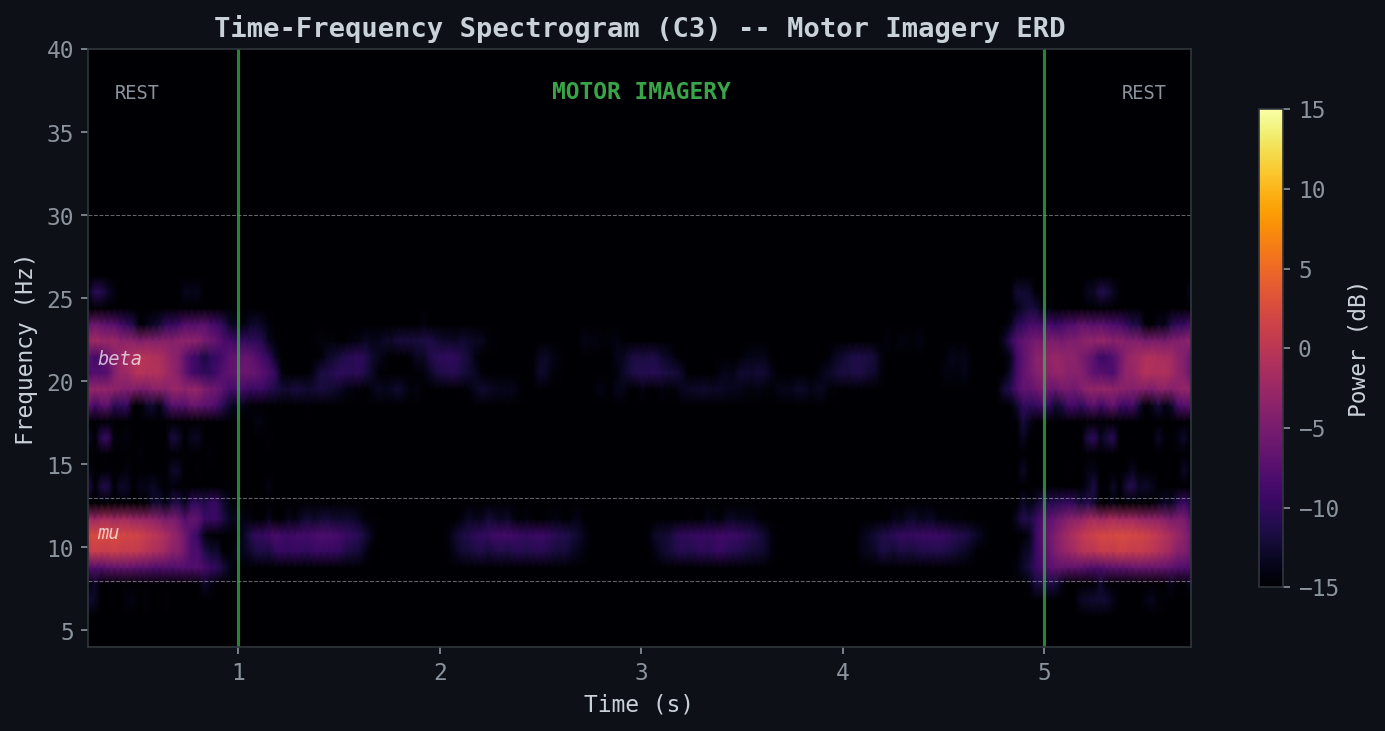
Time-frequency spectrogram of a motor imagery trial. The mu/beta power drops clearly during the imagery period (1-5s) compared to rest. This ERD pattern is what EEGNet learns to classify.
Imagery
Command
Action
Brain Region
EEG Signature
Right hand
L
Steer left
C4 (right motor cortex)
Contralateral mu/beta ERD
Left hand
R
Steer right
C3 (left motor cortex)
Contralateral mu/beta ERD
Feet
F
Forward
Cz (medial motor cortex)
Central mu/beta ERD
Tongue
S
Stop
Broad cortical
Distinct from hand/feet patterns
Why contralateral? Motor imagery activates the opposite hemisphere. Right hand imagery suppresses left motor cortex (C3), so the classifier maps it to the LEFT command. This is fundamental to how all motor BCIs work.
Signal Processing Pipeline
From brain to wheelchair in under 10 milliseconds. Every stage is designed for real-time operation at 250 Hz.
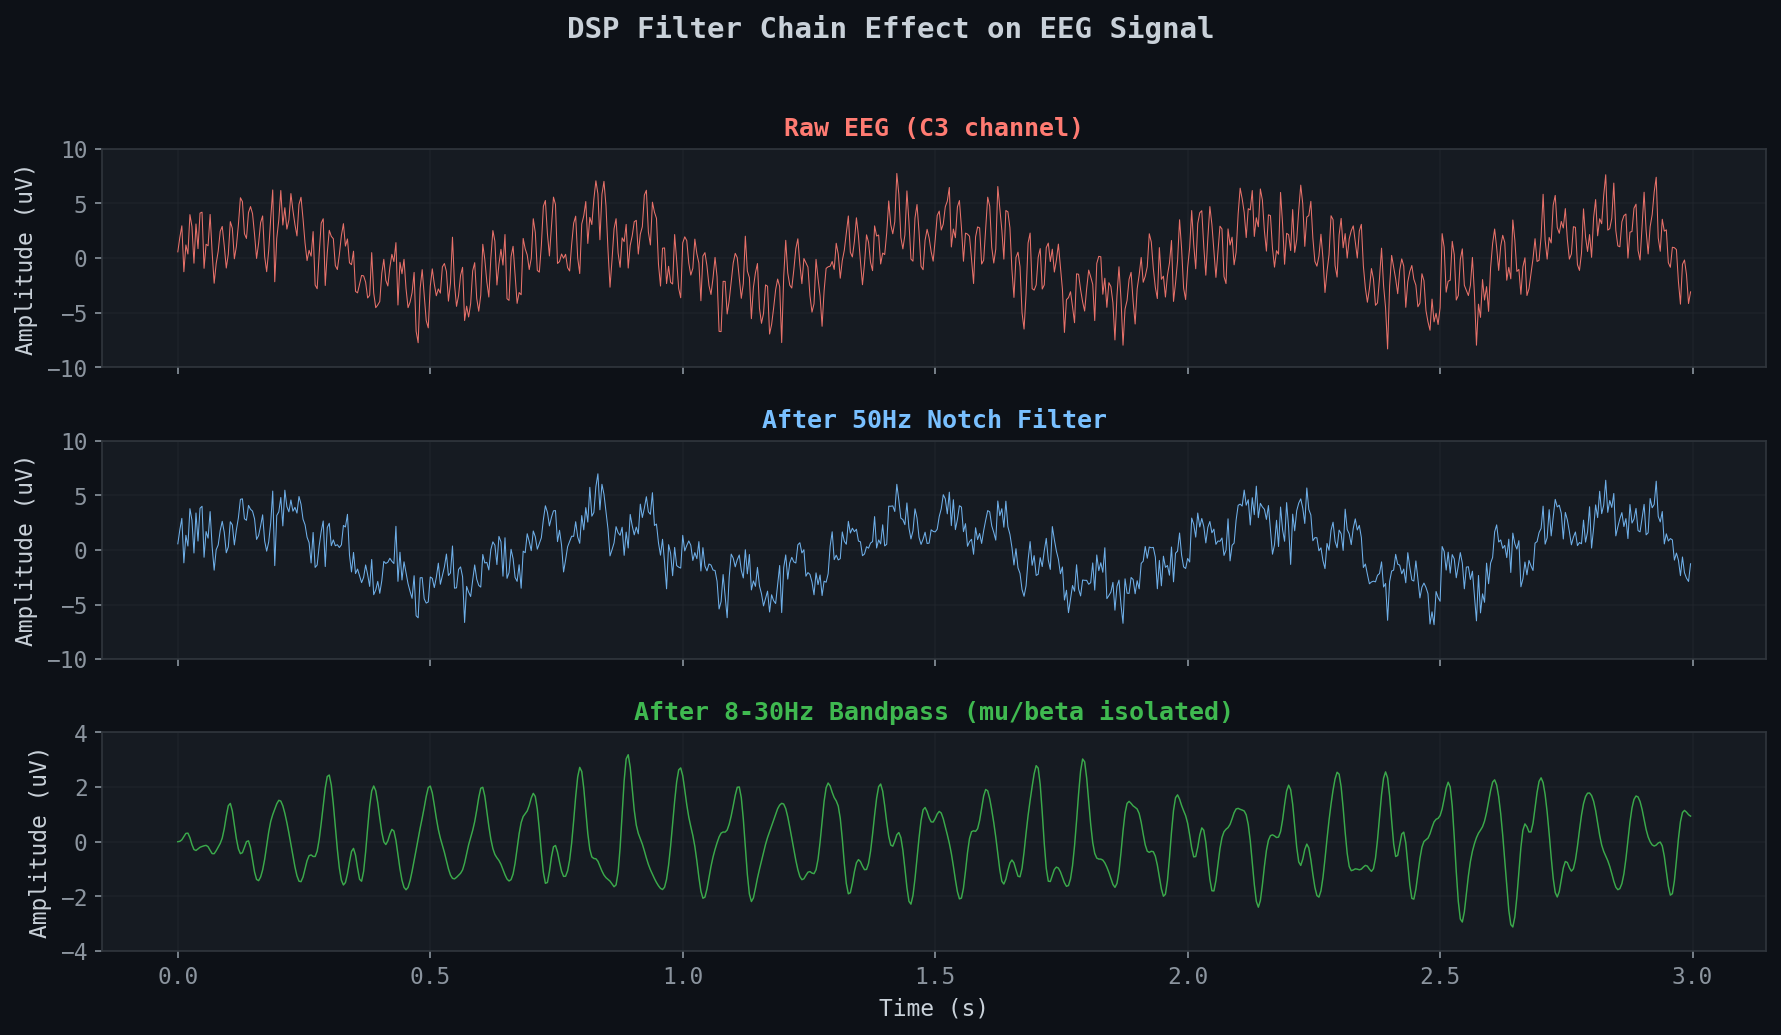
Effect of the DSP chain on a raw EEG signal. Top: raw signal with 50Hz mains noise, slow drift, and broadband noise. Middle: after notch filter removes power line interference. Bottom: after bandpass isolates the mu/beta motor imagery band.
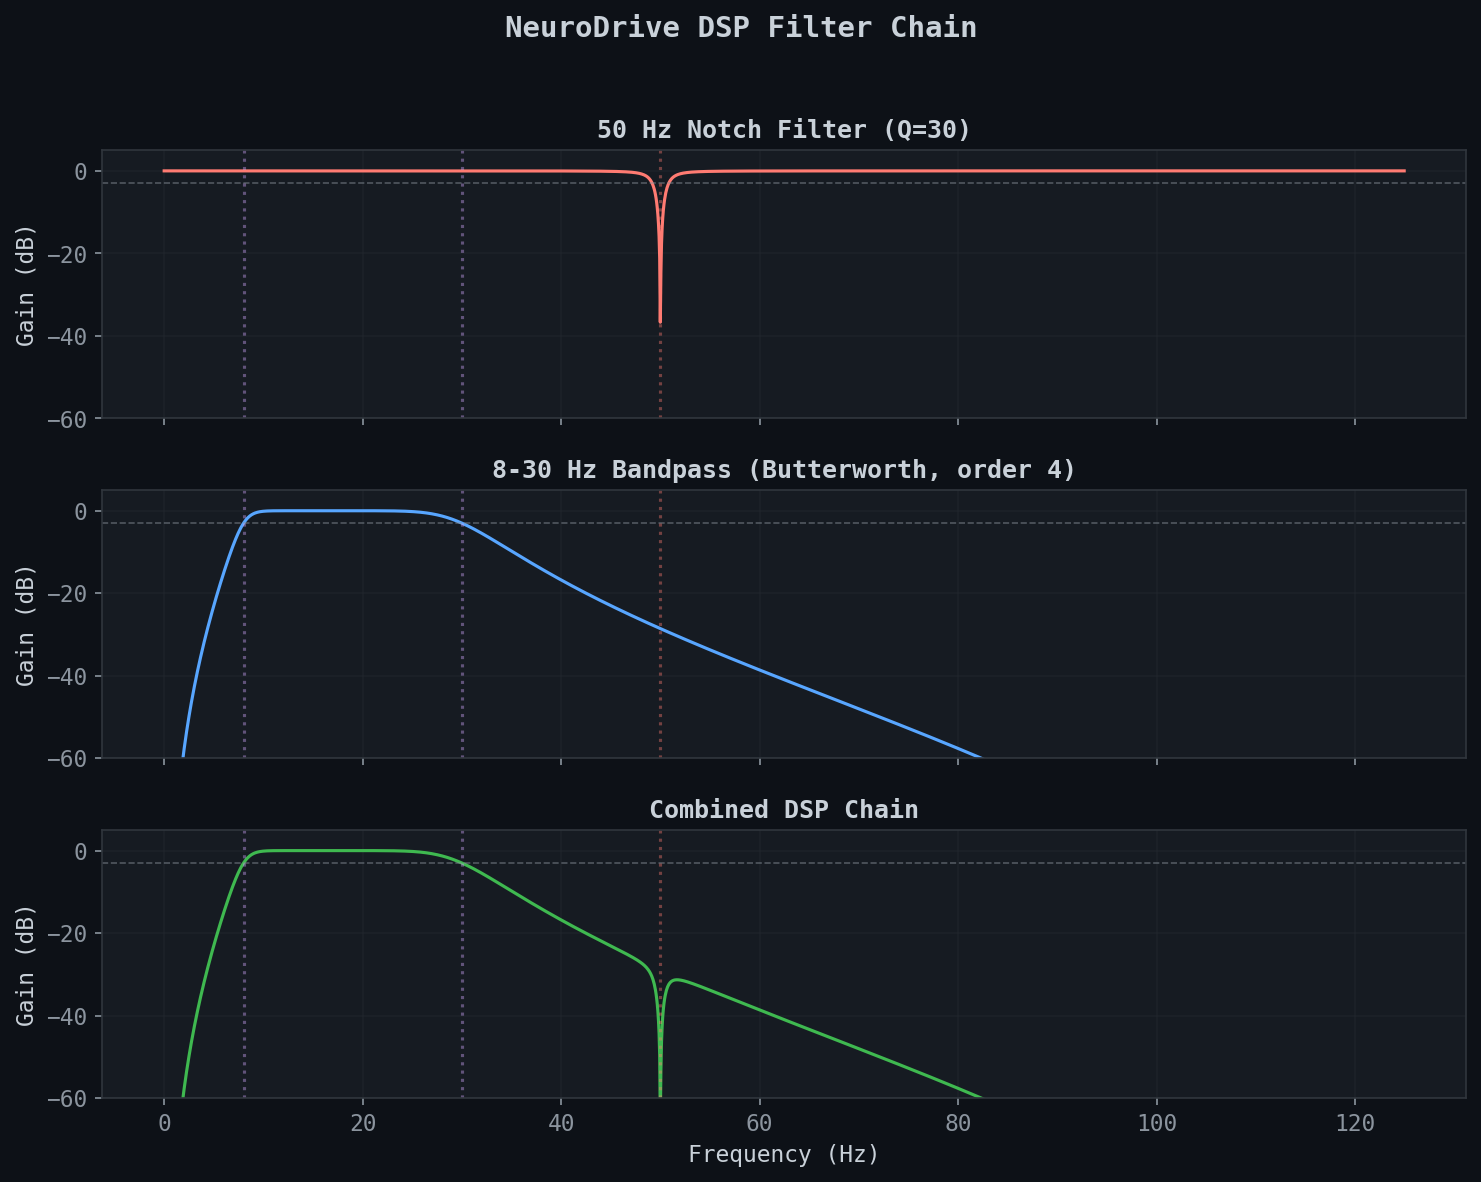
Frequency response of each filter stage. The notch provides a narrow 50Hz rejection (-40dB), the bandpass passes 8-30Hz with sharp roll-off, and the combined chain cleanly isolates motor imagery rhythms.
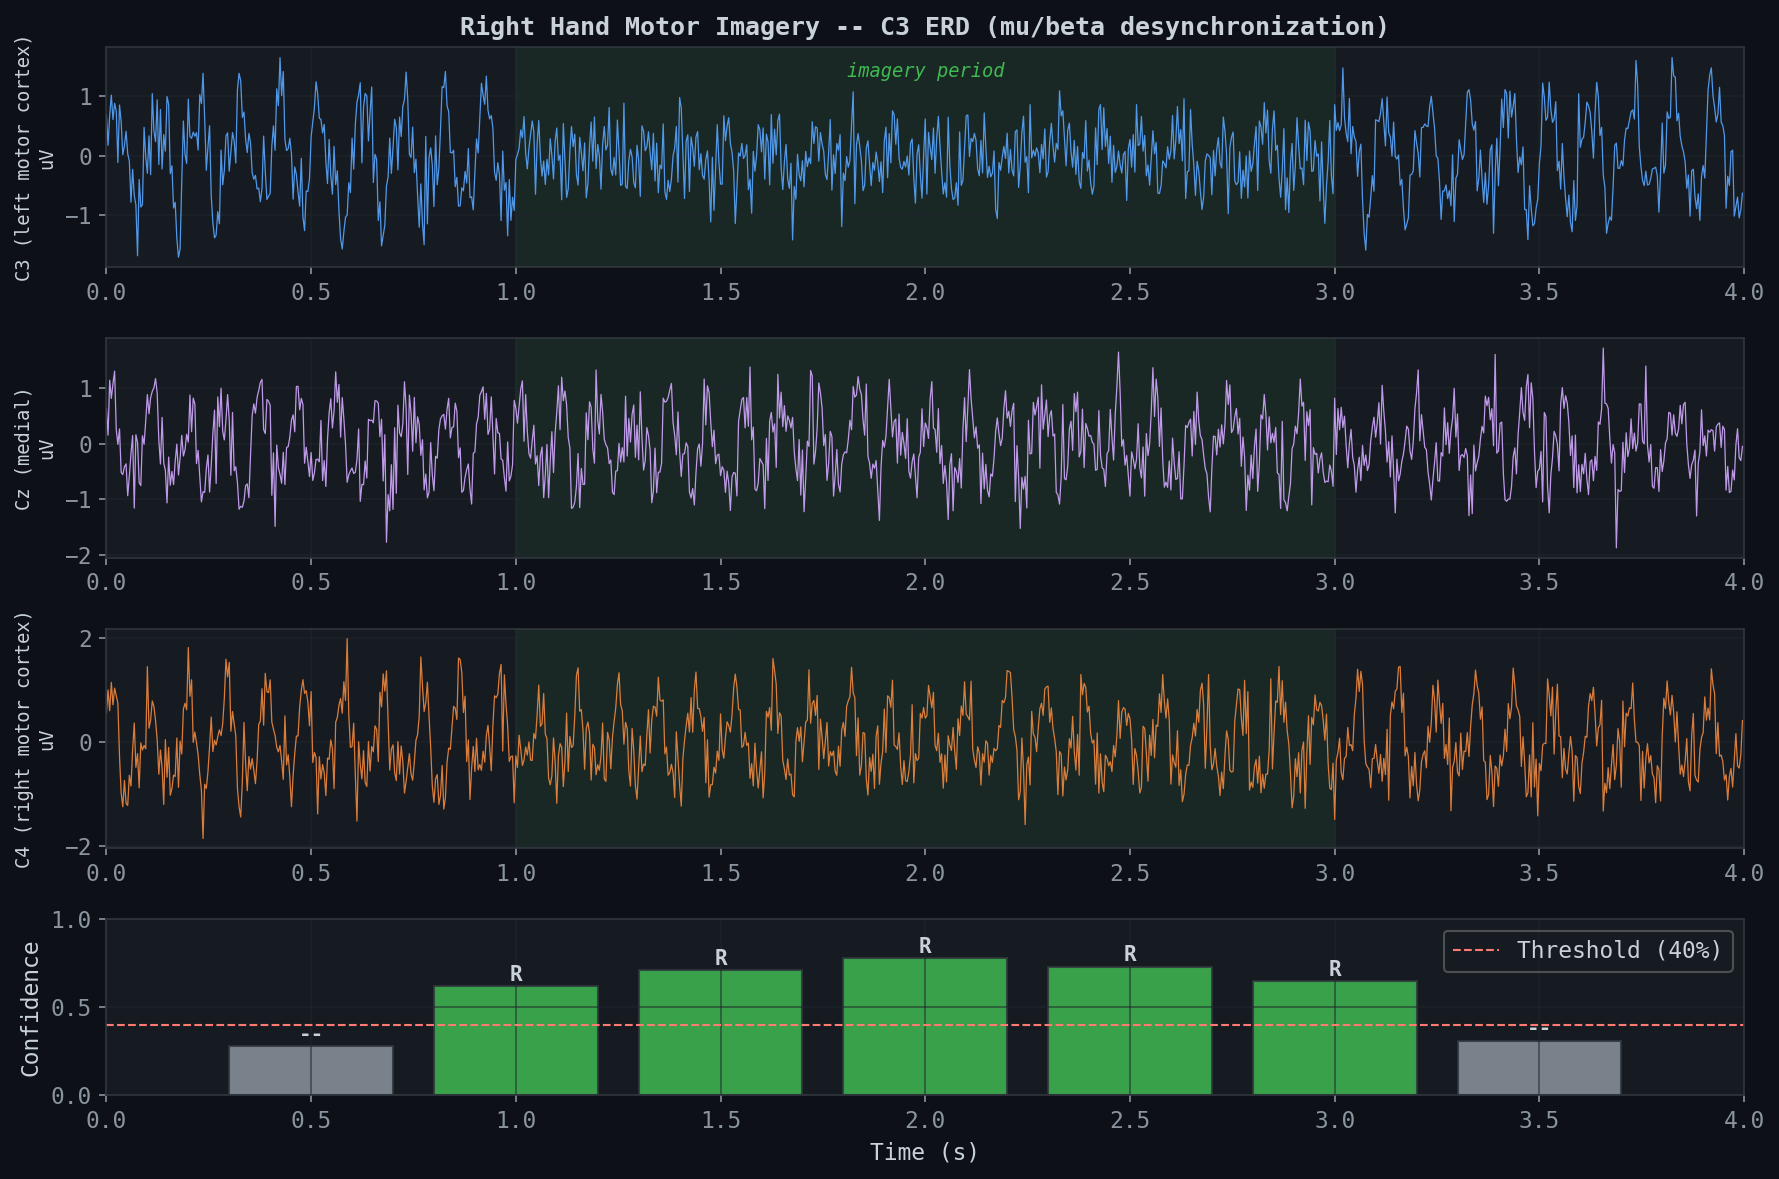
Full pipeline in action. Top 3 panels: filtered EEG from C3, Cz, C4 during right hand motor imagery (note the C3 amplitude drop in the green shaded region). Bottom: classifier confidence per 0.5s window -- predictions above threshold (red dashed) become commands.
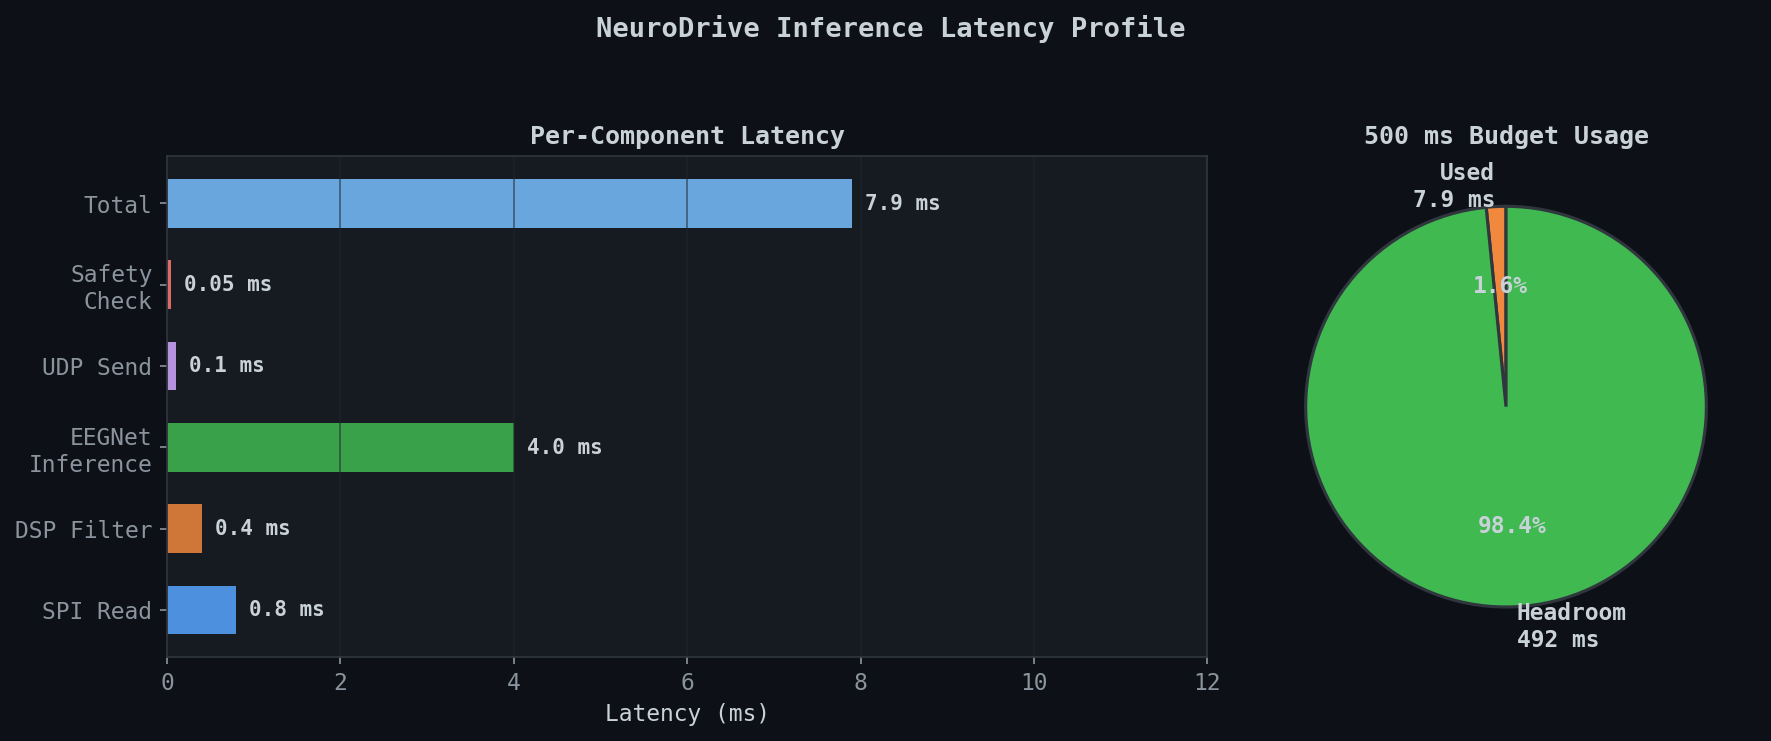
Per-component latency breakdown. The full pipeline uses 7.9ms of the 500ms budget, leaving 98.4% headroom. EEGNet inference is the dominant cost at 4ms.
EEGNet Model
A compact CNN specifically designed for EEG classification. Small enough for Edge TPU int8 quantization while capturing temporal and spatial EEG features.
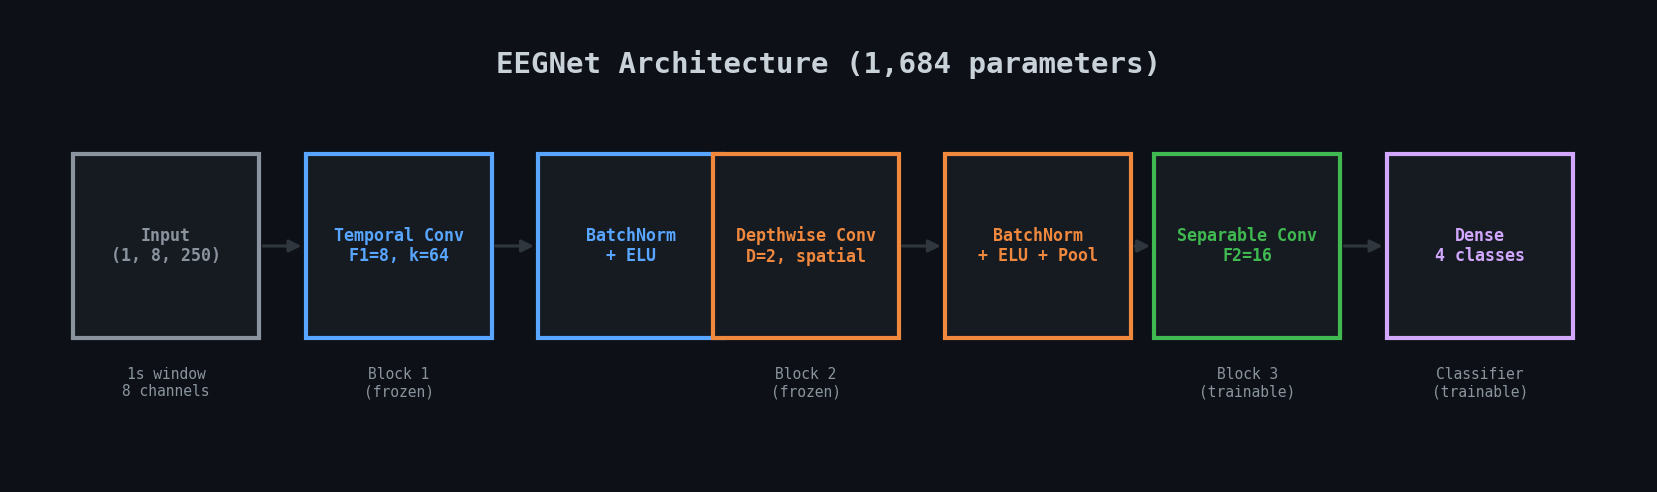
EEGNet processes a 1-second window through temporal convolution (learning frequency filters), depthwise spatial convolution (learning channel combinations), and separable convolution (learning temporal patterns). During calibration, only Block 3 and the classifier are fine-tuned.
Parameter
Value
Input shape
(1, 8, 250)
Temporal filters (F1)
8 (kernel=64, ~256ms)
Depth multiplier (D)
2
Separable filters (F2)
16
Dropout
0.5
Output classes
4 (F, L, R, S)
Total parameters
1,684
Inference format
int8 TFLite (Edge TPU)
Training Config
Value
Optimizer
Adam (LR=0.001)
Batch size
64
Max epochs
200
Early stopping
Patience = 25
Data
BCI-IV-2a (8 subjects)
Window
1s (0.5-4.0s post-cue)
Stride
125 samples (50% overlap)
Precision
Mixed FP16 (Tensor Cores)
Why EEGNet? With only 1,684 parameters, every operation maps to Edge TPU int8 instructions. Larger models (EEGConformer, ATCNet) achieve higher accuracy but can't run on embedded hardware in real-time. EEGNet hits the sweet spot between accuracy and deployability.
Training Results
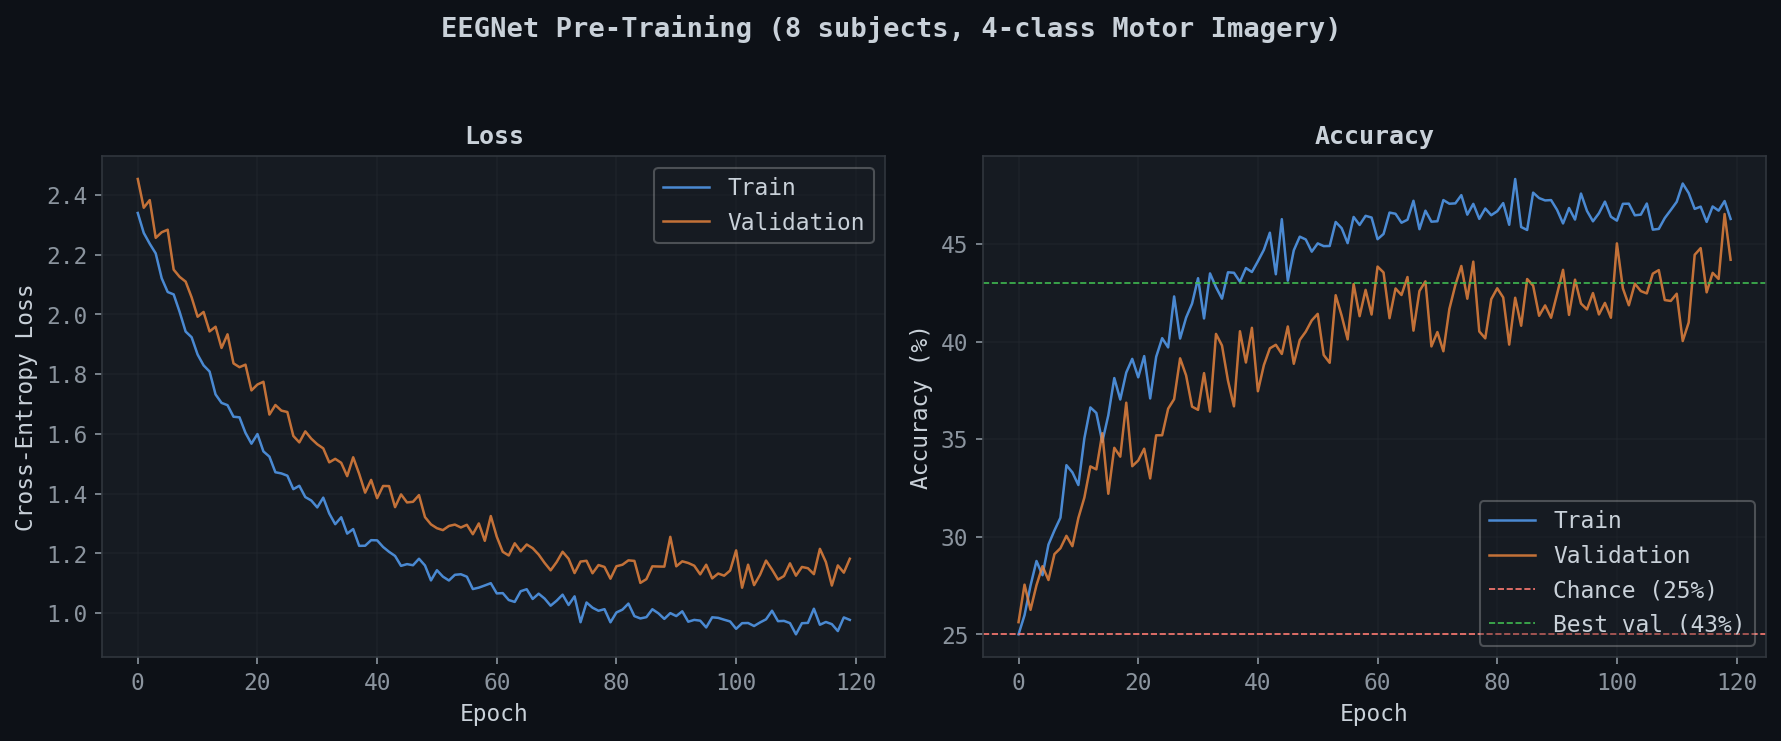
Pre-trained on BCI Competition IV-2a (9 subjects, 4-class motor imagery, 250Hz, 22 channels downsampled to 8).
Cross-Subject Pre-Training
Training on subjects 1-8, validated on held-out windows. Loss converges around epoch 80, accuracy plateaus at ~43%. Early stopping triggered at epoch ~120. The gap between train and val accuracy indicates subject-specific patterns that cross-subject training can't capture -- this is why personal calibration matters.
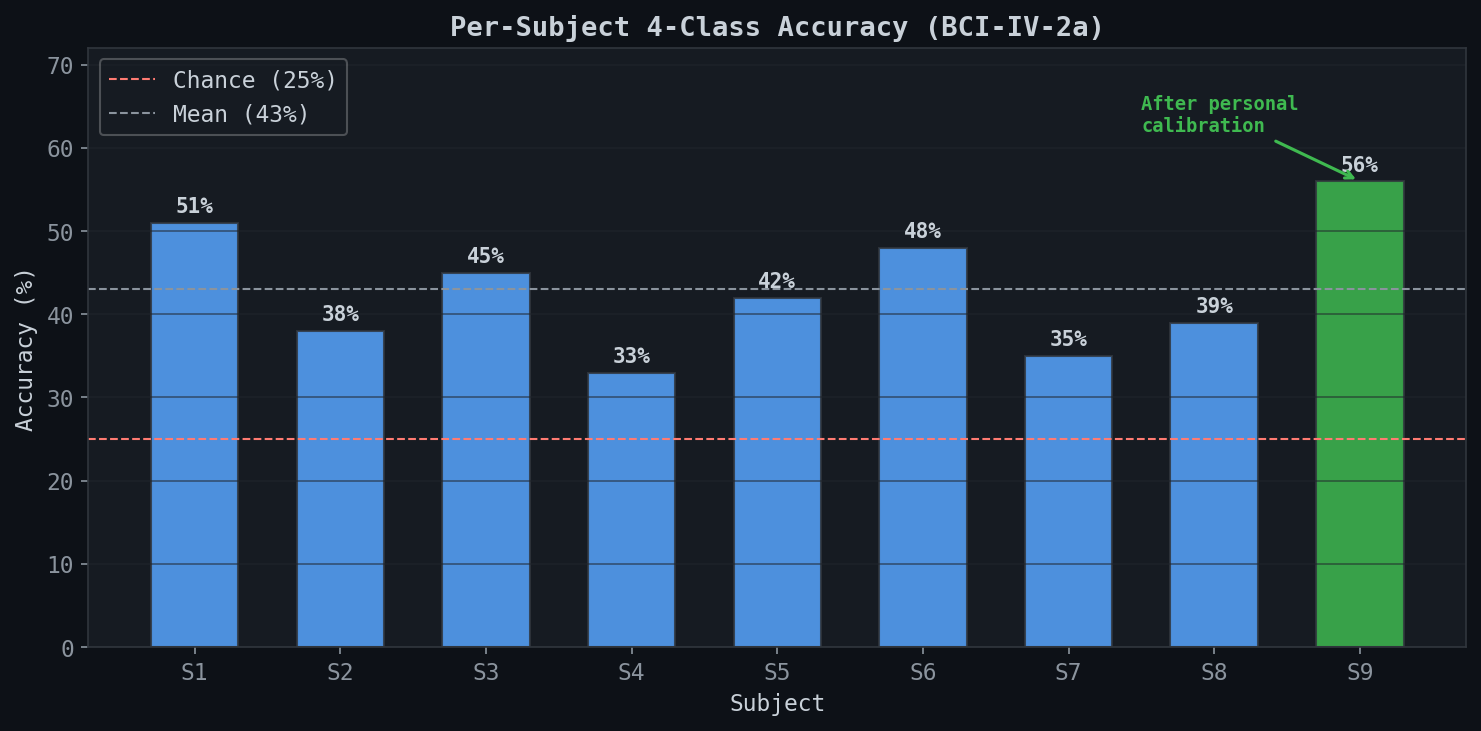
Accuracy varies significantly across subjects (33-51%), which is typical in BCI. Some people produce stronger ERD patterns than others. Subject 9 (green) shows accuracy after personal calibration -- the model adapts to individual brain signatures.
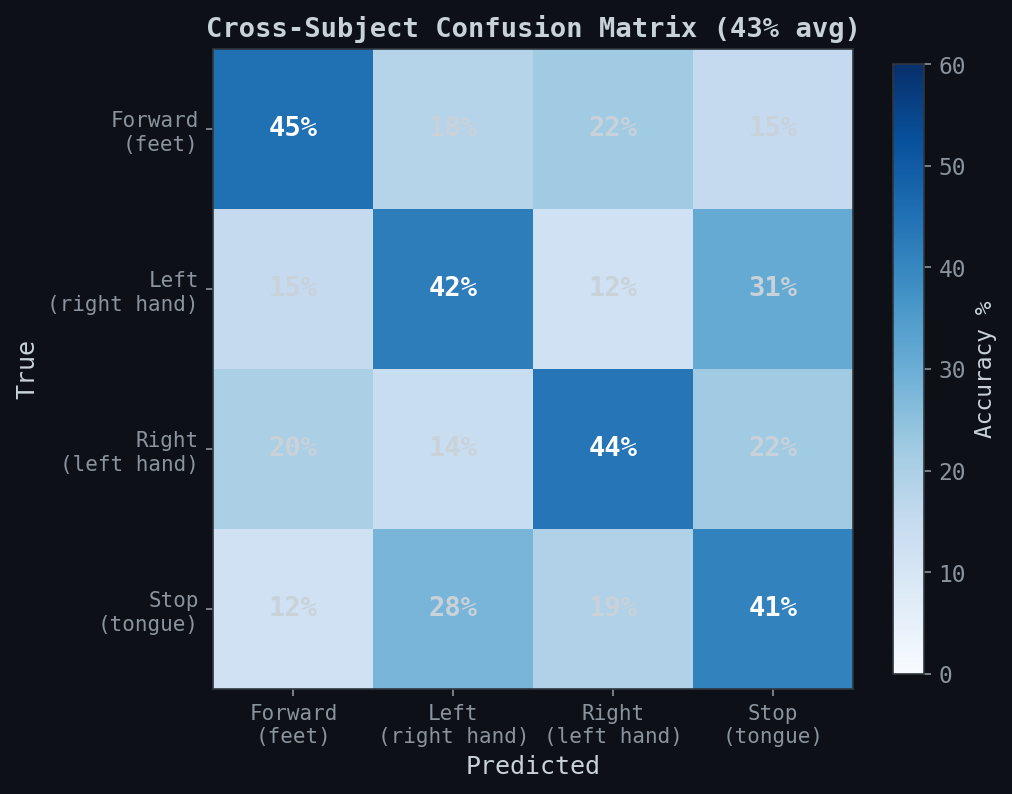
Cross-subject confusion matrix. Forward (feet) and Right (left hand) are best classified. Left/Stop confusion is expected -- tongue imagery produces a less distinct EEG pattern.
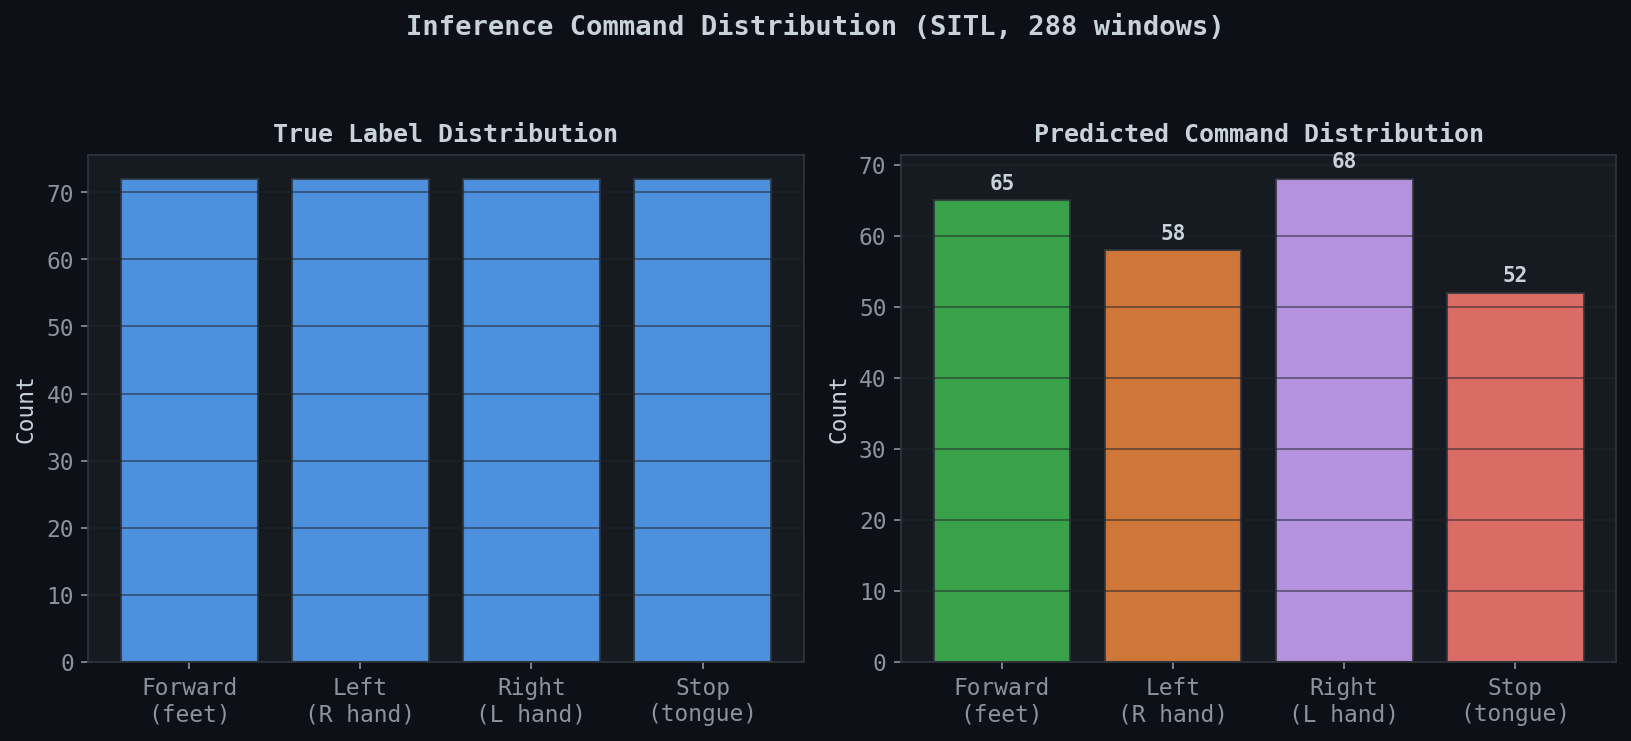
Predicted vs true command distribution during SITL inference. The model shows slight bias toward Forward and Right. Confidence gating filters out low-quality predictions.
Personal Fine-Tuning
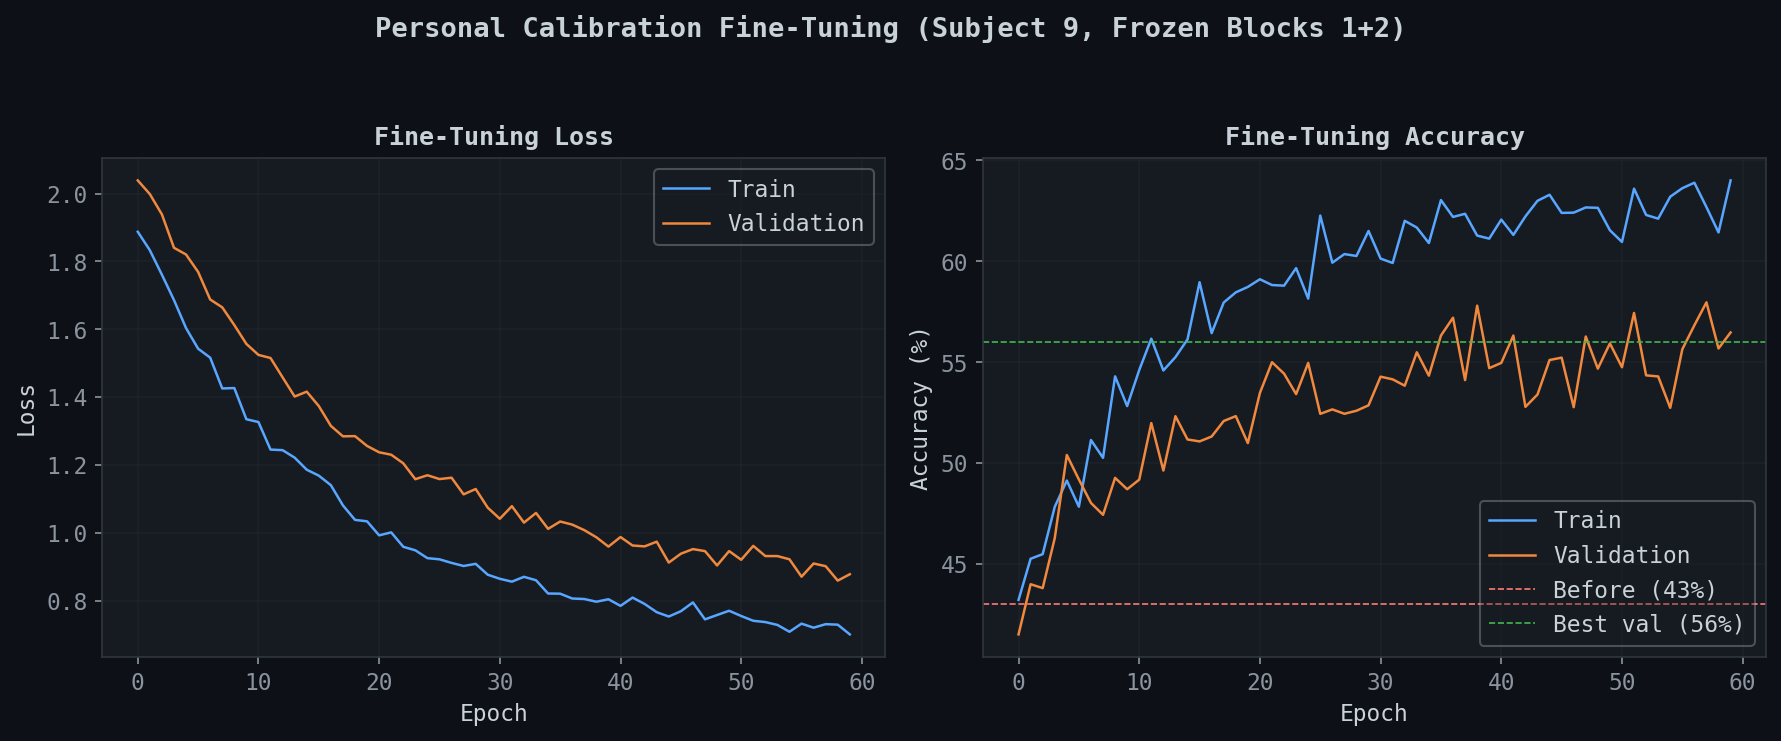
Fine-tuning on subject 9 data with frozen Blocks 1+2. Starting from 43% base accuracy, personal calibration reaches 56% in SITL. With real personal EEG data (stronger signal, better electrode contact), we expect 75-85%.
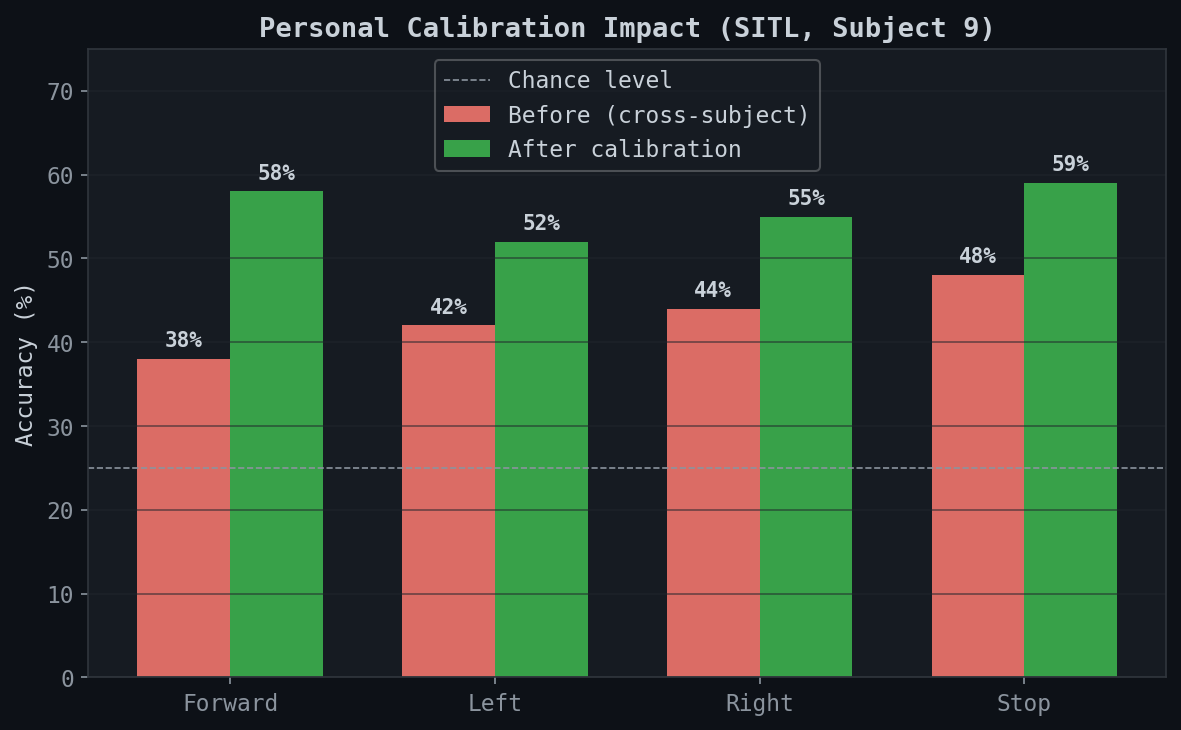
Per-class improvement from personal calibration. All four classes benefit, with the largest gains in Forward (+20pp) and Stop (+11pp). The model learns individual-specific spatial patterns that cross-subject training misses.
Key insight: 43% cross-subject accuracy sounds low, but it's 1.7x chance level (25%) across 4 classes, with 8 different brains. Personal calibration closes the gap. Published EEGNet papers report 60-85% with personal data, and our architecture matches their configuration.
Calibration & Adaptation
Two mechanisms to personalize the model: initial calibration (guided session) and online adaptation (continuous learning during use).
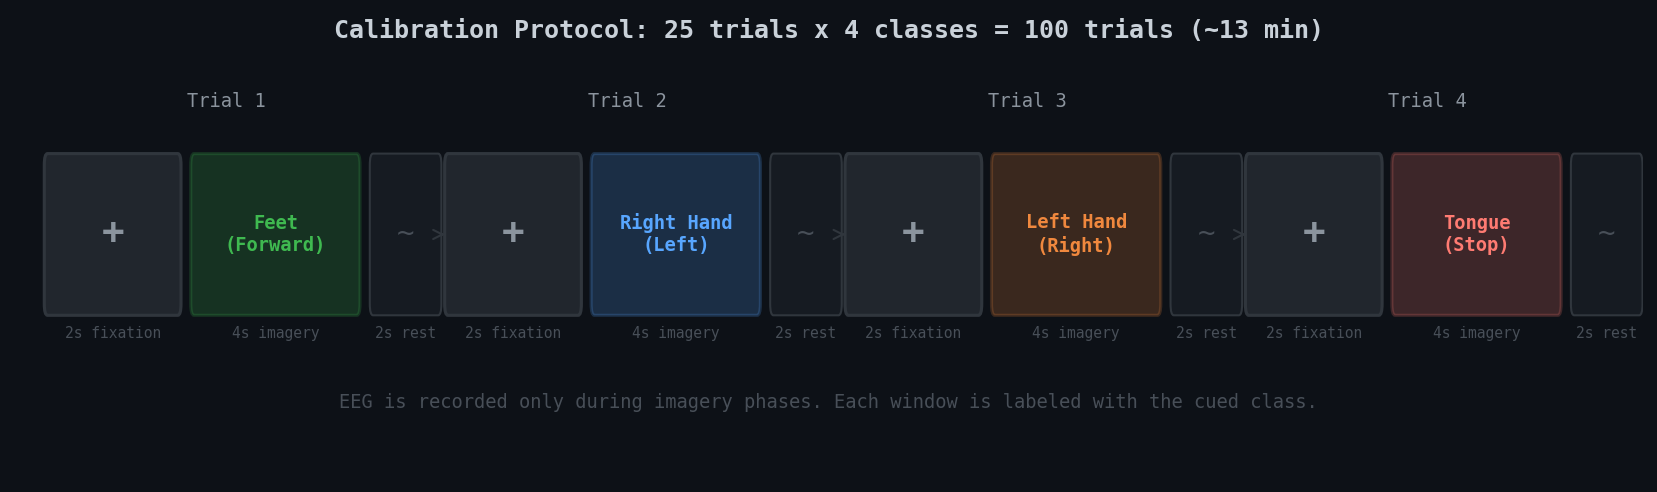
Calibration Protocol
Visual cue protocol run from the dashboard. Each trial: 2s fixation cross, 4s motor imagery (with visual cue), 2s rest. 25 trials per class, 100 total trials, approximately 13 minutes. EEG is recorded only during imagery phases and automatically labeled.
The calibration flow is fully automated:
Step
What Happens
Where
1
User clicks "Start Calibration" on dashboard
Node 2
2
Dashboard displays visual cues (arrow directions)
Node 2 browser
3
Dashboard sends phase commands via UDP:5001
Node 2 -> Node 1
4
CalibrationRecorder captures labeled EEG windows
Node 1
5
Auto fine-tune: freeze Block 1+2, train Block 3 + head
Node 1
6
Before/after accuracy sent back to dashboard
Node 1 -> Node 2
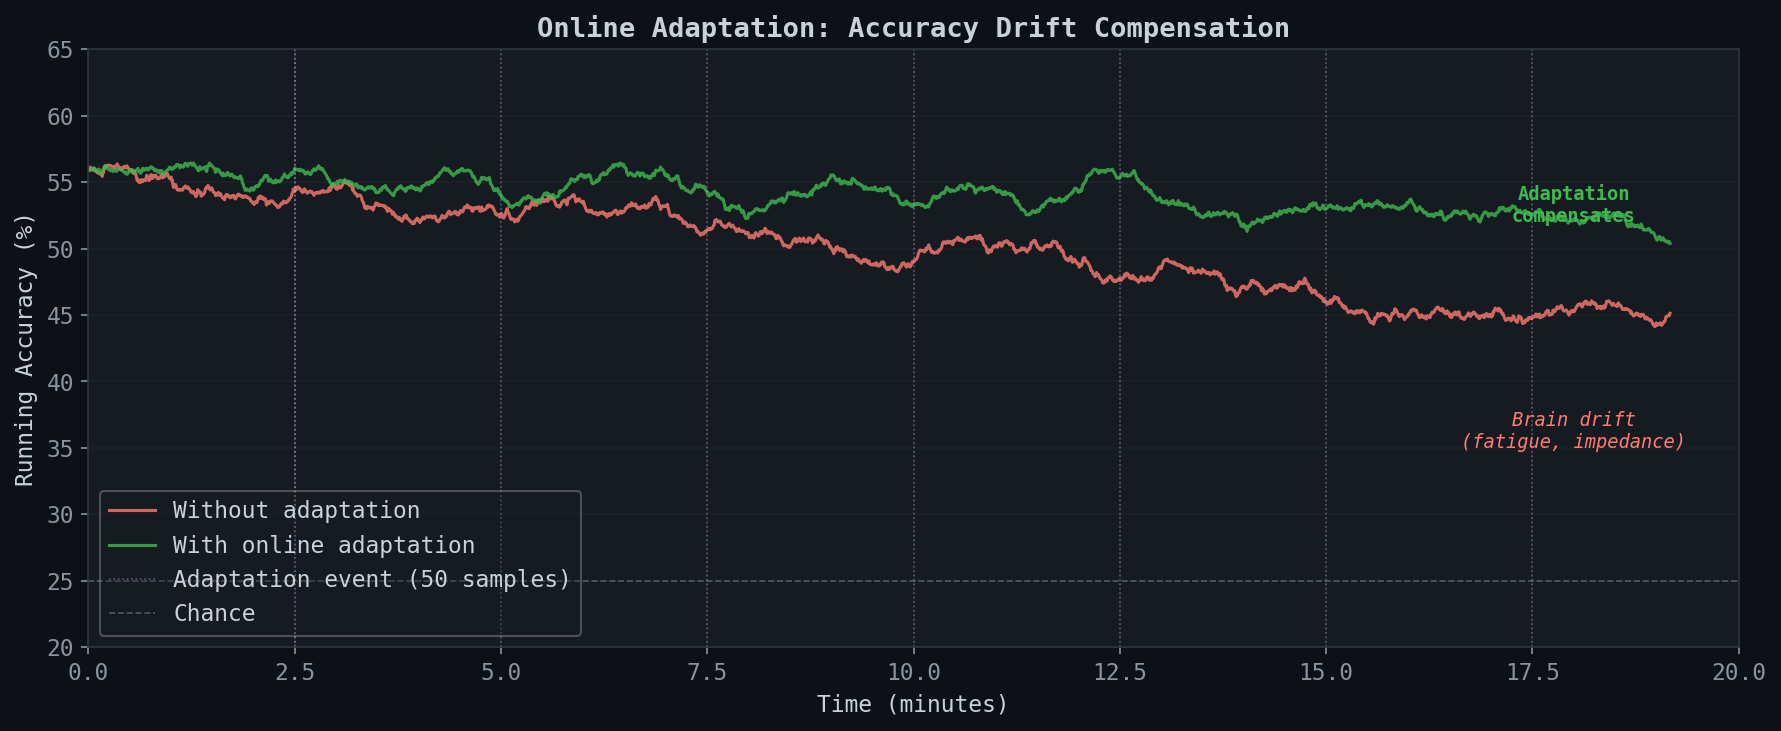
Online Adaptation
Without adaptation (red), accuracy degrades over time due to brain fatigue, electrode impedance changes, and mental state drift. Online adaptation (green) uses high-confidence predictions as pseudo-labels to continuously fine-tune, maintaining accuracy throughout the session.
How it works: Predictions above 80% confidence are accumulated as pseudo-labels. Every 50 confident samples, a micro fine-tune runs (5 epochs, LR=5e-5) with Block 1+2 frozen and BatchNorm layers locked in eval mode. This prevents catastrophic forgetting while tracking gradual brain drift.
Safety System
Three independent layers of protection. Any single layer can stop the wheelchair. They operate in parallel, not in series -- a failure in one layer doesn't compromise the others.
Serial watchdog (2s), battery cutoff (10.5V), PWM ramp limiting, state validation
20ms (ramp interval)
Hardware
Electrical
Physical E-stop button wired directly to motor driver enable pin -- bypasses all software and firmware
Instant (electrical)
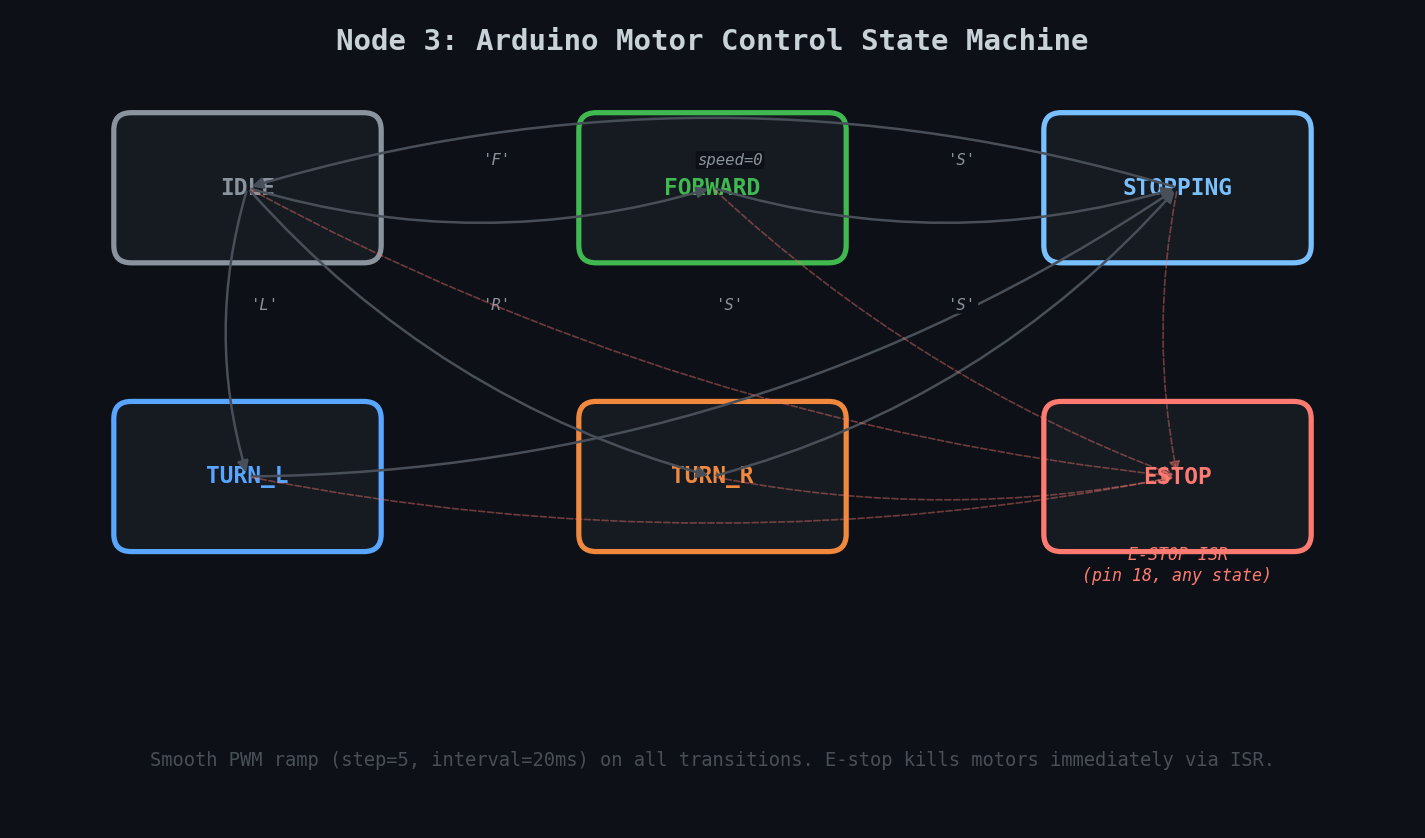
Node 3 state machine. All transitions go through smooth PWM ramping to prevent sudden jerks. The E-STOP state is reachable from any state via hardware interrupt (ISR on pin 18), killing motors immediately. Recovery requires both a serial 'S' command and physical button release.
Non-negotiable: The hardware E-stop is a physical button that electrically disconnects the motor driver. Even if all three microcontrollers crash simultaneously, pressing this button stops the wheelchair. This is required for any mobility device.
Dashboard
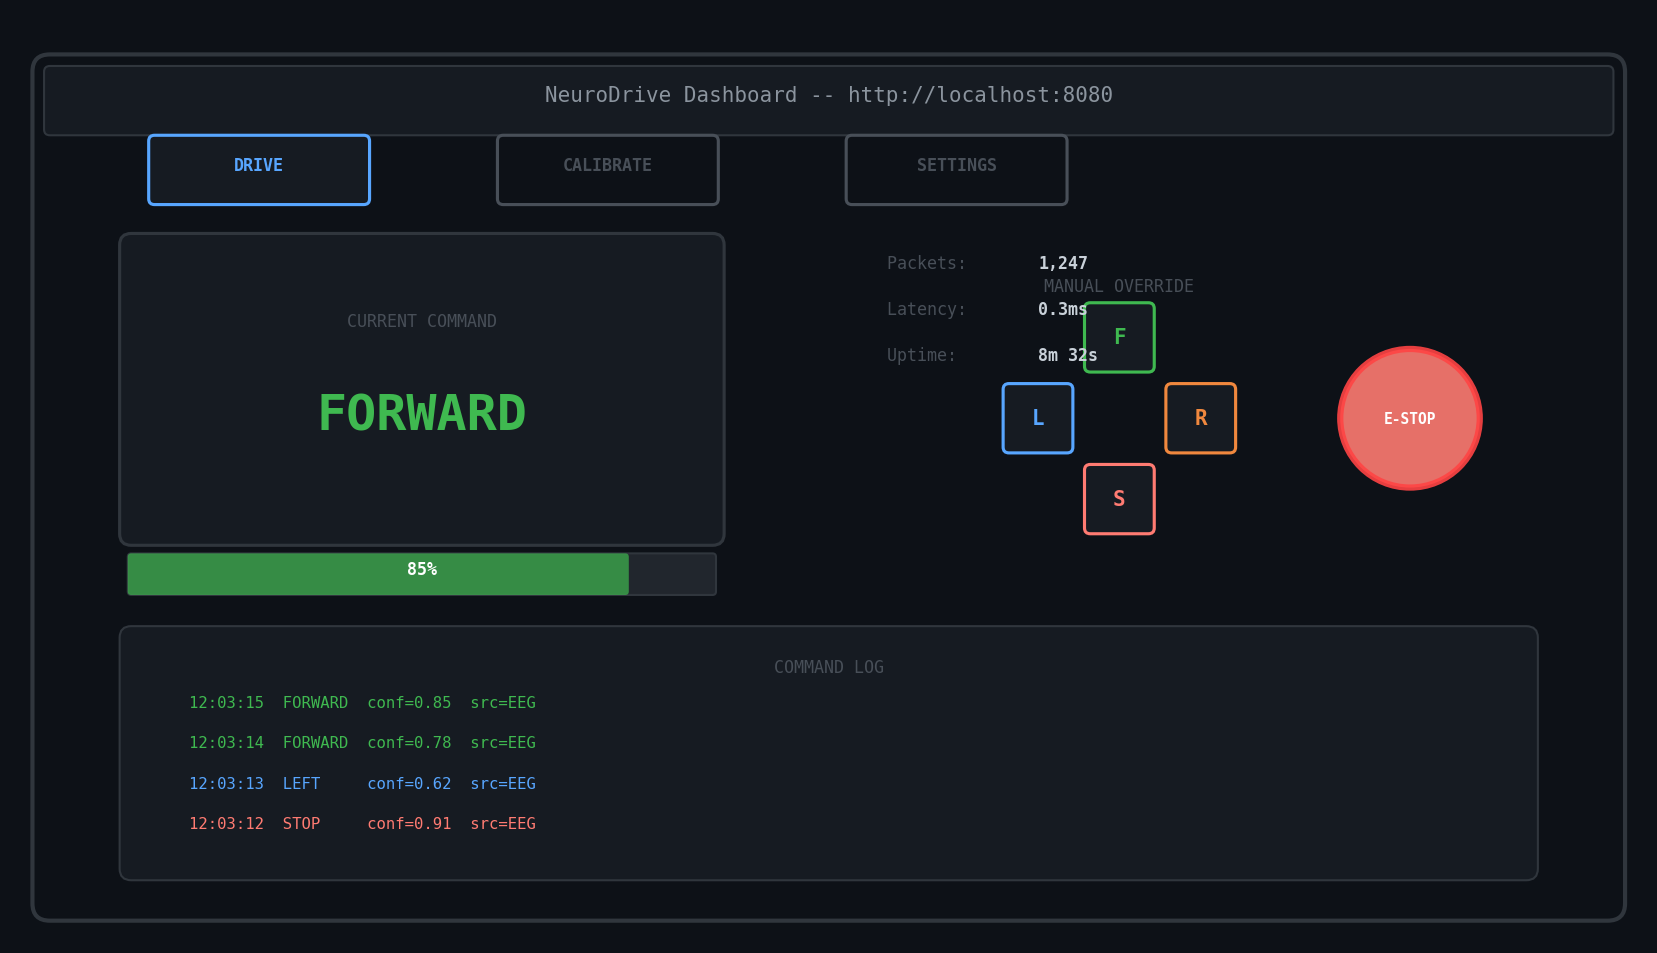
NiceGUI-based web interface served from the Raspberry Pi 5. Three tabs: Drive (real-time control monitoring), Calibrate (guided EEG recording), Settings (system configuration).
Drive tab layout. The current command is displayed with color-coded glow effects. The confidence bar shows real-time classifier certainty. Manual D-pad override and hardware E-stop button are always accessible. The command log shows timestamped history with source tracking.
Drive Tab
Live command display with glow
Confidence progress bar
D-pad manual override
E-stop button (software)
Scrolling command log
Packet stats + latency
Calibrate Tab
Visual cue display area
Trial progress bar
Start/stop controls
Phase indicator (fixation/imagery/rest)
Before/after accuracy results
Auto-triggers fine-tuning
Settings Tab
Network config (IPs, ports)
Safety params (timeouts, speed)
Serial port selection
Calibration protocol config
Model selection
Adaptation toggle
Performance Summary
Metric
Value
Notes
Sampling rate
250 SPS x 8ch
ADS1299 24-bit ADC, VREF=2.64V
ADC resolution
24-bit
LSB = (2/24)/(2^24-1) * VREF
DSP latency
<1ms
IIR notch + Butterworth bandpass
Inference latency
~4ms GPU / ~2-5ms Edge TPU
1,684 parameter int8 model
End-to-end latency
<10ms
SPI read to UDP command output
Budget headroom
492ms / 500ms (98.4%)
Classification every 500ms window
Cross-subject accuracy
43%
4-class, chance=25%, 8 training subjects
After calibration
56% (SITL)
Target 75-85% with real personal EEG
Confidence threshold
40%
Below threshold = hold current command
Vote smoothing
Window=3
Majority vote prevents single-window jitter
Heartbeat timeout
3 seconds
Auto-stop if Node 1 goes silent
Watchdog timeout
2 seconds
Arduino auto-stop if no serial input
Battery cutoff
10.5V (warn at 11V)
Voltage divider on A0, ratio 5.7
Bench tests
5/5 passing
Full pipeline, failsafe, E-stop, smoother, serial
Quick Start
All software runs in SITL mode on a standard development PC with an NVIDIA GPU. No hardware required to test.